In this case study
Strengthen your processes and increase data-driven decision-making for faster study start-ups.
Industry State: Clinical Trials Budget Modeling
For the past 10 years the industry has seen an increased demand to determine fair market value of CRO and other clinical trial service providers. Not only do these costs account for the largest portion of the direct clinical trial cost at the onset of the trial, but the change orders associated with these cost categories are the main culprits for significant cost swings during the trial execution. While total negotiated cost is of importance during planning and budgeting exercises or CRO negotiation, the estimation of actual activity- completed costs and accurate time- distribution of cost throughout the life cycle of the trial (reforecasting), are equally critical for financial planning and reporting and for overall study risk management.
Most attempts to determine fair market value have been centered around creating benchmarking databases that primarily focus on average spend for CRO core cost categories and simple outsourcing strategy modeling. Two major approaches have emerged in the industry: a) cost category benchmarking based on average bid cost and b) activity-based benchmarking based on resource rates. The first approach proved unsuccessful due to the inherent complexity of clinical trials: averaging activity costs based on vendor bids does not reflect the unique nuances of the study protocol and operational strategy. The second approach gained a lot of popularity in the industry, however it continues to prove challenging in three key areas:
Activity-level discrepancies: while commercial benchmarking tools claim accuracy at the total cost level, significant variances are consistently observed at the major and minor cost category level, rendering these tools ineffective in CRO negotiations. Discrepancies are primarily caused by the fact that these tools cost only a small sample of activities compared to the actual activities performed by the service providers and generated by the
CRO native costing tools, leading to forced cost aggregations and unrealistic variances. Cost distribution challenges: commercial cost benchmarking tools use simplistic distribution algorithms, e.g. straight line, and a limited number of cost drivers, leading to
inaccurate cost distributions and unreliable forecasts. Plan vs. actual variances: current solutions are primarily focused on budget planning and lack the outsourcing / bidding component as well as the actual budget management throughout the entire life cycle of the contract; these approaches lead to an inherent disconnect between initial cost estimates and the cost intelligence associated with actual budget tracking, thus limiting the usability of the tools to upfront planning.
In today's dynamic pharmaceutical outsourcing environment, having an initial total budget estimate is simply not enough for portfolio management, where studies are in constant flux and at different stages of completion. Having significant experience with current industry approaches and budget modeling challenges, Strategikon Pharma conducted a systematic study of currentapproaches and their limitations and is proposing novel approaches to clinical study planning and modeling that service the entire life-cycle of clinical studies.
Clinical Maestro™: Eight Cost Modeling Dimensions
Instead of simplifying clinical trial costing complexity by focusing on activity or rate card benchmarking, Clinical Maestro™ embraces it through sophisticated software, advanced statistics, artificial intelligence and focus on expertise resulting in far more accurate modeling, forecasting and cost driver modeling.
The Clinical Maestro™ approach is based on multi-dimensional examination of cost drivers, backed by expert knowledge and input coming from both sides of the industry: Sponsors and CROs. In the process of fine-tuning clinical trial cost modeling we identified eight distinct factors, each uniquely contributing to the accuracy and power of the cost modeling engine.
1. Comprehensive Standardized Activity Library
Clinical Maestro™ costing methodology is based on granular activity modeling. We embarked on an extensive journey to identify and build a core activity library with the target of covering more than 95% of industry commonly outsourced tasks. We have divided the clinical trial costs into six major service categories: Clinical Study Conduct, Biostatistics, Data Management, Pharmacovigilance, Regulatory and Systems. We then gathered a panel of experts for each category to include experienced pharma and CRO domain experts, cost proposal, outsourcing and finance. Since the industry is lacking activity standards, the expert panel generated harmonized activity lists that are reflective of the comprehensive activities performed by either pharma and CROs during the clinical trial conduct.
To illustrate our approach, let's take the example of Regulatory Affairs Activities. Instead of focusing on building a rigid bid grid, or harmonizing naming conventions, we focused on core activities, such as outlined in the example below.
We circulated the activities with both CRO and Sponsor experts to make sure that we are covering all core activities within the service categories. Based on panel consensus we logged the tasks in the Clinical Maestro™™ library and started building unique costing algorithms for each task.
2. Resource Standardization
The second major component of the clinical trial budgeting is resource allocation. Unfortunately, very few attempts have been made to date to harmonize resources, resulting in significant discrepancies between and among pharma companies and the CROs. Similar to our effort to standardize activity lists, Strategikon Pharma invested in defining generic resources and then assigning these resources to activities.
Core to our approach was to move away from titles and focus on experience. By working with both industry and HR experts we defined 3 experience bands, which are most commonly accepted in the industry: <5 years, 5-10 years and above 10 years. Upon creating a comprehensive list of resources, we categorized each in one of the three bands. For example, in Project Management we may observe a variety of titles, such as Project Manager, Project Leader, Global Project Director, Associated Director-Project Management, Senior Director-Project Management, etc. Attempting to harmonize titles would lead to fruitless results, as these titles vary greatly by organization size, maturity and culture. Clinical Maestro™™ approach was to define only 3 core roles in project management, based on our defined experience bands and apply allocate resources to activities based on the most common experience blends observed by both pharma and CROS. The result was a commonly accepted resource allocation model which produced consistently more accurate resource demand estimates than the title-based allocations.
3. Global Rates Blending
Commercial budgeting tools and the CROs place a lot of energy in guarding and negotiating rate cards. While rate cards do influence overall cost of each tasks, Strategikon Pharma analysis identified the rate card impact to be significantly lower than commonly prophesized. We conducted in-depth analyses of published salary reports and of "rack" and "preferred" global and regional rate cards for small, medium and top CROs; The summary of findings is outlined below:
- Across the industry there is little and predictable variance between industry players; the variance between global blended rates across small, medium and large CROs is consistently less than 10% across most resource categories.
- Rate cards continue to vary by continent e.g. Europe vs North America and region, e.g. Europe- Nordics, Europe- Central, Europe- East, following a consistent average ratio of billable to salary
- Smaller CROs are not necessarily cheaper than larger CROs on a per rate basis because they tend to allocate more senior resources to activities than larger CROS.
- Clinical Maestro™ rate card database contains regional and country-level blended rate cards for all core resources allocated to the conduct of clinical activities identified in the Maestro comprehensive task library. To refine cost modeling and increase prediction accuracy we moved away from simplistic generic approaches and focused on unique rate card blending, which is based on both the study locations and the resource location.
To illustrate, using the above example of Regulatory Affairs activities, let us consider the activity of IND/CTA Development. Across the industry, we identified 7 unique resources that are most commonly associated with the preparation of the IND/CTA; the weight and effort of each resource is based on the Module that is being developed, the phase and complexity of the trial, the number of prior clinical and non-clinical studies conducted. Regardless of the actual study locations, these resources are most commonly located in North America and Western Europe and the most accurate rates are the blended or unique rates of these regions. In addition, the resources allocated on this task are commonly found in the ">10 years" experience band, which the highest cost pool in the database.
4. Effort Allocation
Once the resources are standardized, the allocation of resource effort allocation tends to be consistent across Sponsors for CRO for most baseline tasks. Major effort drivers are associated with the complexity matrix, as described in section 6 below. However, each organization functions differently which causes unique variances on effort allocation. Rather than ignoring the organizational component, Clinical Maestro™ highlights it as a distinctive differentiation factor among service providers during the bidding process.
To illustrate using the case of Project Management: routine project management tasks are associated with managing sponsor interactions, 3rd party vendors and project reporting. Clinical Maestro™ collected an average effort for each project management resource type and each distinct sub-activity based on the software defined complexity matrix, which results in a range of effort, e.g. hours, for project management. The baseline estimate is adjusted based on additional cost drivers, such as number of global locations to produce a reliable effort estimate. However, the Clinical Maestro™™ estimates should only be viewed as effort guidelines to better understand the CRO operational model. Having more effort, or higher blended costs for certain cost categories can actually constitute a competitive advantage for service providers. Underestimation of effort, particularly during initial bidding, will inherently lead to subsequent change orders during the trial conduct.
In a recently competed case study, we analyzed the Clinical Maestro™ cost accuracy in two bidding scenarios: "bid to spec" (Sponsor provided detailed assumptions for bidding) and "bid to expertise" (Sponsor provided minimum assumptions, e.g. protocol, and asked the CROs to estimate effort based on their expertise). Four top CROs participated in the bidding exercise and effort ranges were compared among the CROs and the Clinical Maestro™ pre-RFP budget estimate.
- In the "bid to spec" scenario, the variance between CRO bids was less than 5%, while the variance between the median cost of the CROs and the Clinical Maestro™ model was less than 2%. The efforts were consistent for 75% of the tasks in a fully outsourced model.
- In the "bid to expertise" scenario, the variance between CRO bids was greater than 40% and between the median cost of the CROs and the Clinical Maestro™ model was almost 25%.
Deep dives into effort estimates revealed the effort ranges was caused by variances in assumptions, e.g. number of countries, number of vendors to manage, frequency of meetings with Sponsor, etc., and not the global rate or the resource mix.
Clinical Maestro™ allows for unprecedent exposure of assumptions, both operational and time- related, which in turn resulting in reliable cost estimates, such as exemplified above.
5. Cost Driver Modeling
Clinical Maestro™ features an impressive inventory of cost drivers, both operational and organizational, which allows us to fine tune the algorithms for each unique task.
To illustrate the Clinical Maestro™ approach in the earlier example for Regulatory Affairs Activities, activity- IND/CTA Development, Clinical Maestro™ tracks the effort and resource blend for each cost driver of this task, in the same way the CROs would model in their costing tool and the Sponsor would approach the work should that activity be performed internally.
In the Central Assumptions Panel, Clinical Maestro™ tracks both Prior and Concurrent studies as well as protocol complexity and associated amendments.
The Sponsor or the CRO can change these assumptions to fine tune the effort impact associated with these drivers.
In addition, at the Service level, the effort is broken down both by Module (user can add/remove modules) and submission type, e.g. eCTD, CDs, and hybrid.
With this level of detail in cost drivers the estimated effort associated with the development of IND/CTA becomes highly predictable and consistent among service providers and Sponsors, with most variances being caused by the specific operating model of the Service Provider and level of efficiency, e.g. technology utilization.
6. Complexity Matrix: Protocol and Phase
In addition to the location-based complexity, Clinical Maestro™ tracks activity-based effort on a two-dimensional matrix: protocol complexity and phase. All tasks have an associated complexity factor which may include both dimensions, or only one factor.
7. Hybrid Task Refinement
Clinical Maestro™ features an embedded RACI for each task, which allows for adjusting effort level based on responsibilities. Instead of assuming that tasks are either the responsibility of the Sponsor or the Provider, Clinical Maestro™ captures the nuances of shared responsibilities. We approach shared responsibilities in two different manners: a) location-based, e.g. Sponsor is responsible for Country A, Provider for Country B and C and b) based on authoring, as illustrated below:
In this allocation model, Clinical Maestro™ allocated 3 effort levels for Provider:
- Authoring
- Co-authoring (user can allocate %)
- Review
The hybrid task refinement knocks out the common cost variances associated with shared tasks by bringing clarity in assumptions and transparency in responsibilities.
8. Time Distribution Curves
Strategikon believes that cost allocation is as important as total cost estimation. Simple straight- lined allocation does not allow for enough accuracy of cost forecasting by time dimension and study stage, e.g. start-up, execution, close-out.
Each task in Clinical Maestro™ has a defined Start and End Date that mimics industry expectation for the task occurrence as well as a unique cost distribution algorithm. Clinical Maestro™ currently employs several proprietary distribution models, some associated with operational curves, e.g. site activation, patient enrollment, net active patent curves, etc.; others are associated with unique frequencies, e.g. meetings occurring every 4 weeks, or time periods, e.g. DSUR reporting.
Powerful Configuration Options
Rather than taking a hard-nosed approach on assumptions and rate cards we believe Clinical Maestro™'s accuracy and reliability will emerge primarily from its flexibility. Every exposed assumption in Clinical Maestro™ can be modified and adjusted to fit unique protocol and user needs, including effort level, the complexity matrix and the rate cards. Clinical Maestro™'s powerful configuration options is ultimately what differentiates it from any other commercially available trial modeling tool in the industry.
Building Industry's Premier Data Trove™
In addition to sophisticated cost modeling, Clinical Maestro™ collects, through our e-procurement platform, valuable cost and operational data, not only at the bid stage, but throughout the life- cycle of the contract. The Clinical Maestro Data Trove™, which will launch in 2019, will slice and analyze blinded actual effort data with powerful BI/Al technology to refine prediction accuracy. This data will then be made available to CROs so they can benchmark their proprietary effort algorithms against the industry, which we believe will result in even greater alignment and transparency.
Stepping into the Future: Conclusions
Clinical trial budgeting and modeling does not need to be a mystery, nor should it involve excessive effort or resources. Much more than a benchmarking database, Clinical Maestro™ is focused on clinical trial cost modeling, which is the approach CROs are already employing to build bid budgets and manage resources. Clinical Maestro™s accuracy is first and foremost most driven by precision and common approach as a digital costing tool for both Sponsor and CROS.
The accuracy of Clinical Maestro™ has been extensively tested against both lost and won CRO budgets and industry costing tools to consistently yield accuracy of excess of 95% across 80% of the tasks in our inventory. By featuring granular, multi-dimensional cost driver modeling and embedding sophisticated operational planning in the cost scenarios, along with extensive configuration options, Clinical Maestro™ features the industry's most advanced cost modeling engine.
In this case study
Strengthen your processes and increase data-driven decision-making for faster study start-ups.
RESOURCES
Explore Expert Insights and Resources for Clinical Excellence
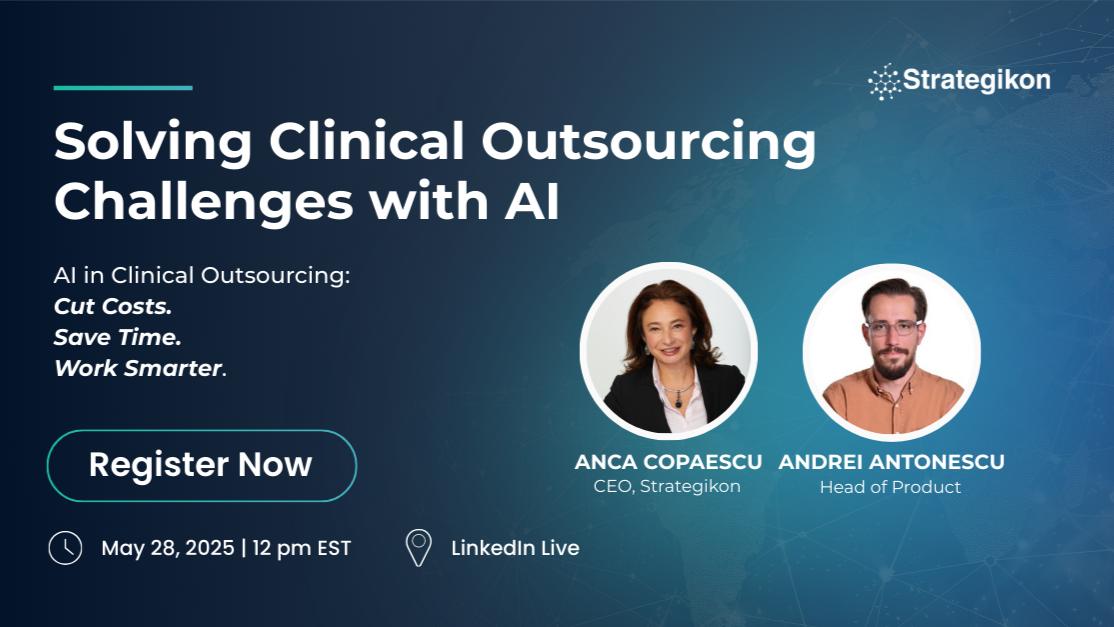
Webinars
Leading biopharmaceutical sponsors trust PORTFOLIO for pipeline planning and budgeting with superior results and reported more than 10x Return on Investment.
Blogs
Effective vendor governance is essential to ensure operational success, cost efficiency, and regulatory compliance.
Case Studies
DEMO
Request a demo
Discover how Strategikon’s advanced solutions can streamline your clinical trial operations. Request a personalized demo to explore how our tools transform budgeting, vendor management, and outsourcing efficiency for pharma and biotech.